Two Maps for “Midterms”
This is what the US election results actually look like
11/13/2022 10:57 pm
US midterm elections not yet decided: Important results are yet to be passed in the House of Representatives. Does the US election map really glow Republican red almost everywhere? ntv.de shows the correct majority in the United States.
In US Congressional elections, vote counting is still going on in many states. As it became known over the weekend, the Democrats – the party of incumbent President Joe Biden – were able to majority in the Senate Defend narrowly. On the other hand, the balance of power in the House of Representatives is still open.
On Sunday evening, 20 out of 435 mandates had not yet been granted. The reason for the delay is, among other things, special electoral rules in different states. Republicans are still ahead in the House of Representatives. Most recently it was 211 to 204 for the party, which also includes former President Donald Trump. The majority limit in the “House” is 218 seats. Opposition Republicans needed only nine additional seats – Democrats, on the other hand, needed 14.
Note: ntv.de infographics are constantly updated.
Traditional US electoral map, electoral districts by region:
Looking at the traditional election map (here: “map view”), due to some peculiarities in US electoral law, the assumption can easily arise that the American population is in favor of the Republicans in this vote. Much of the area glows in Republican Red.
However, the familiar geographic profile paints a vastly distorted picture: in elections to the House of Representatives, MPs are elected by constituency. To this end, the United States is divided into 435 Congressional Districts (“Congressional Districts”), which size roughly according to population size.
Consequence: This division results in significant size differences between densely populated areas, for example on the East and West coasts, and rural areas in the Midwest. Much of the United States glows red: The familiar outline of the traditional election map gives the impression of strong Republican dominance.
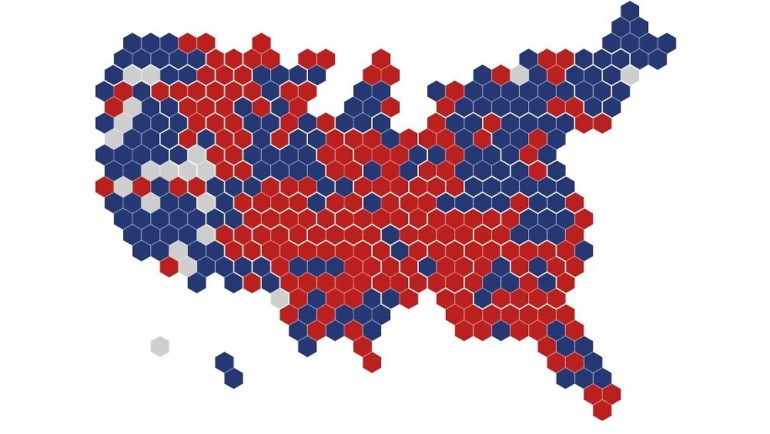
Stylized US electoral map, one size fits all constituencies:
This only happens in sparsely populated rural areas where Republicans are ahead. This makes the party appear stronger than it actually is. Large population centers, where Democrats won in many places, take up less space on the classic US map. This makes them seem small and almost insignificant.
The slant can be quickly corrected: a look at the stylized election map (here: “tile view”) shows the same data – only here the electoral districts are shown in the same size as the hexagonal tiles. In this so-called “tilmap”, each constituency is represented by a regular hexagon. This gives a much more balanced picture in terms of the actual election outcome – the House of Representatives will not be dominated by Republicans in the future. The majority are tight-lipped.
In the midterm elections to be held in the middle of President Biden’s four-year term, all 435 seats in the House of Representatives and 35 out of 100 in the Senate were to be elected. 36 governorships and other important offices were also filled in the states. The distribution of seats in Congress determines how much political authority the incumbent president has for the remaining two years.

Sophie MacKenzie is a contributor to CA News Ottawa, covering news, politics, business, technology, sport, entertainment, and lifestyle. She focuses on clear, accurate reporting and useful information that helps readers stay informed about current affairs and developments that shape their communities. Her work highlights relevant stories, emerging trends, and important issues, presenting them in a balanced, accessible, and reader-friendly manner.